Project
Infrastructure Portfolio & Asset Management Platform
a web-based SaaS platform designed to streamline public works administration across Karnataka, India.
Overview
KSIMYP is a web-based SaaS platform designed to streamline public works administration across Karnataka, India. The application unifies spatial project mapping, multi-year financial forecasting, lifecycle phase tracking, and asset condition monitoring into a centralized dashboard to optimize regional infrastructure delivery.
Approach
I applied the Double Diamond framework to structure the design process, starting with divergent exploration in the Discovery phase to uncover user needs before converging on a precise Problem Definition in the Define phase. From there, I expanded into exploring potential solutions, using continuous testing in the Validate phase to refine our concepts until we finalized and shipped the dashboard in Deliver.
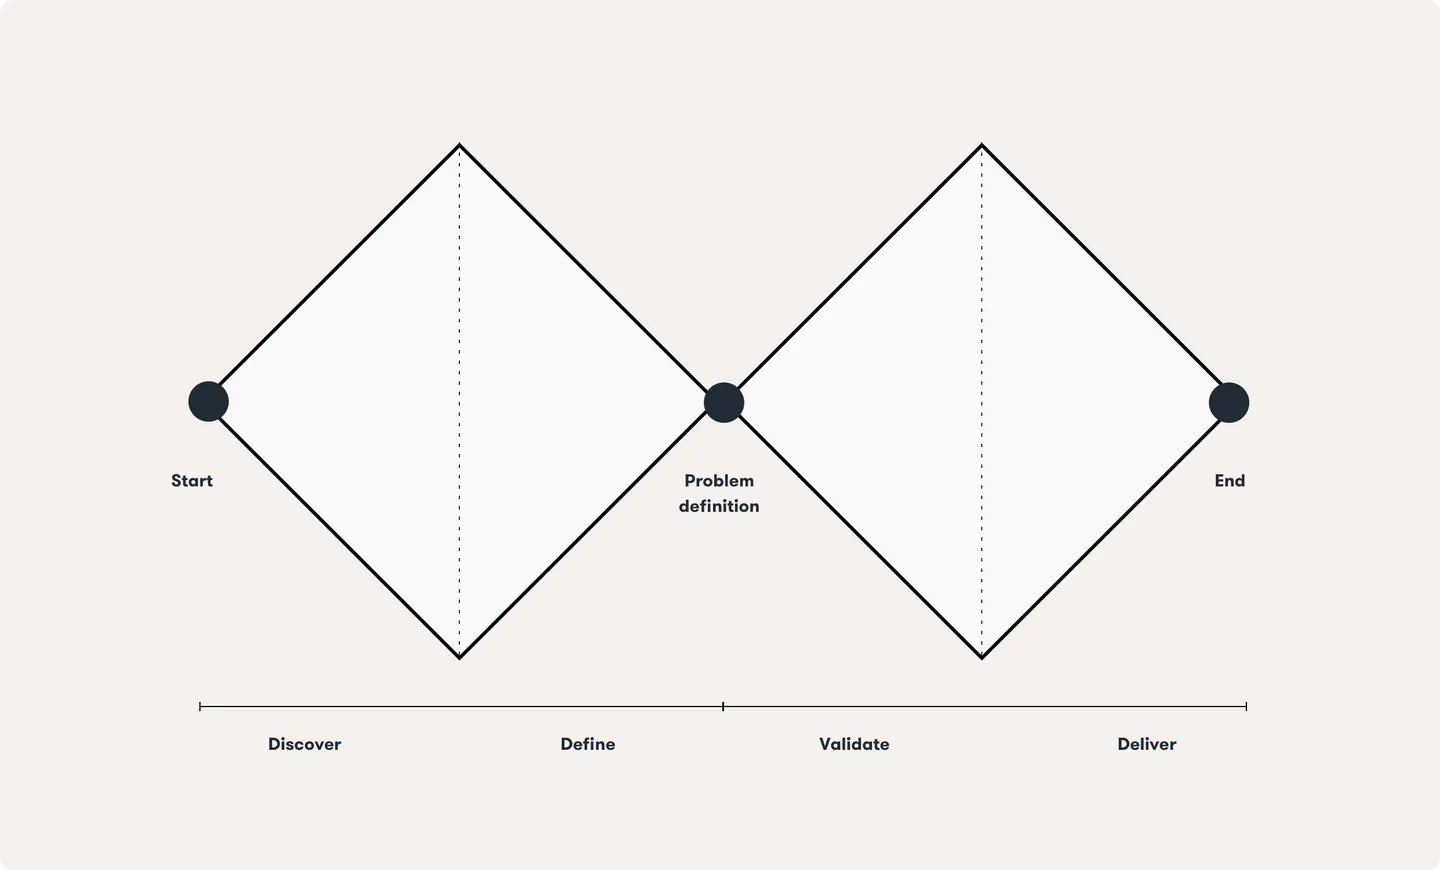
In the Discover phase, I focused on understanding how regional authorities and project managers handle public infrastructure data. My main goal was to map out the current workflow, identify pain points in project tracking, and learn how stakeholders interact with complex budget and maintenance data.
Stakeholder Mapping
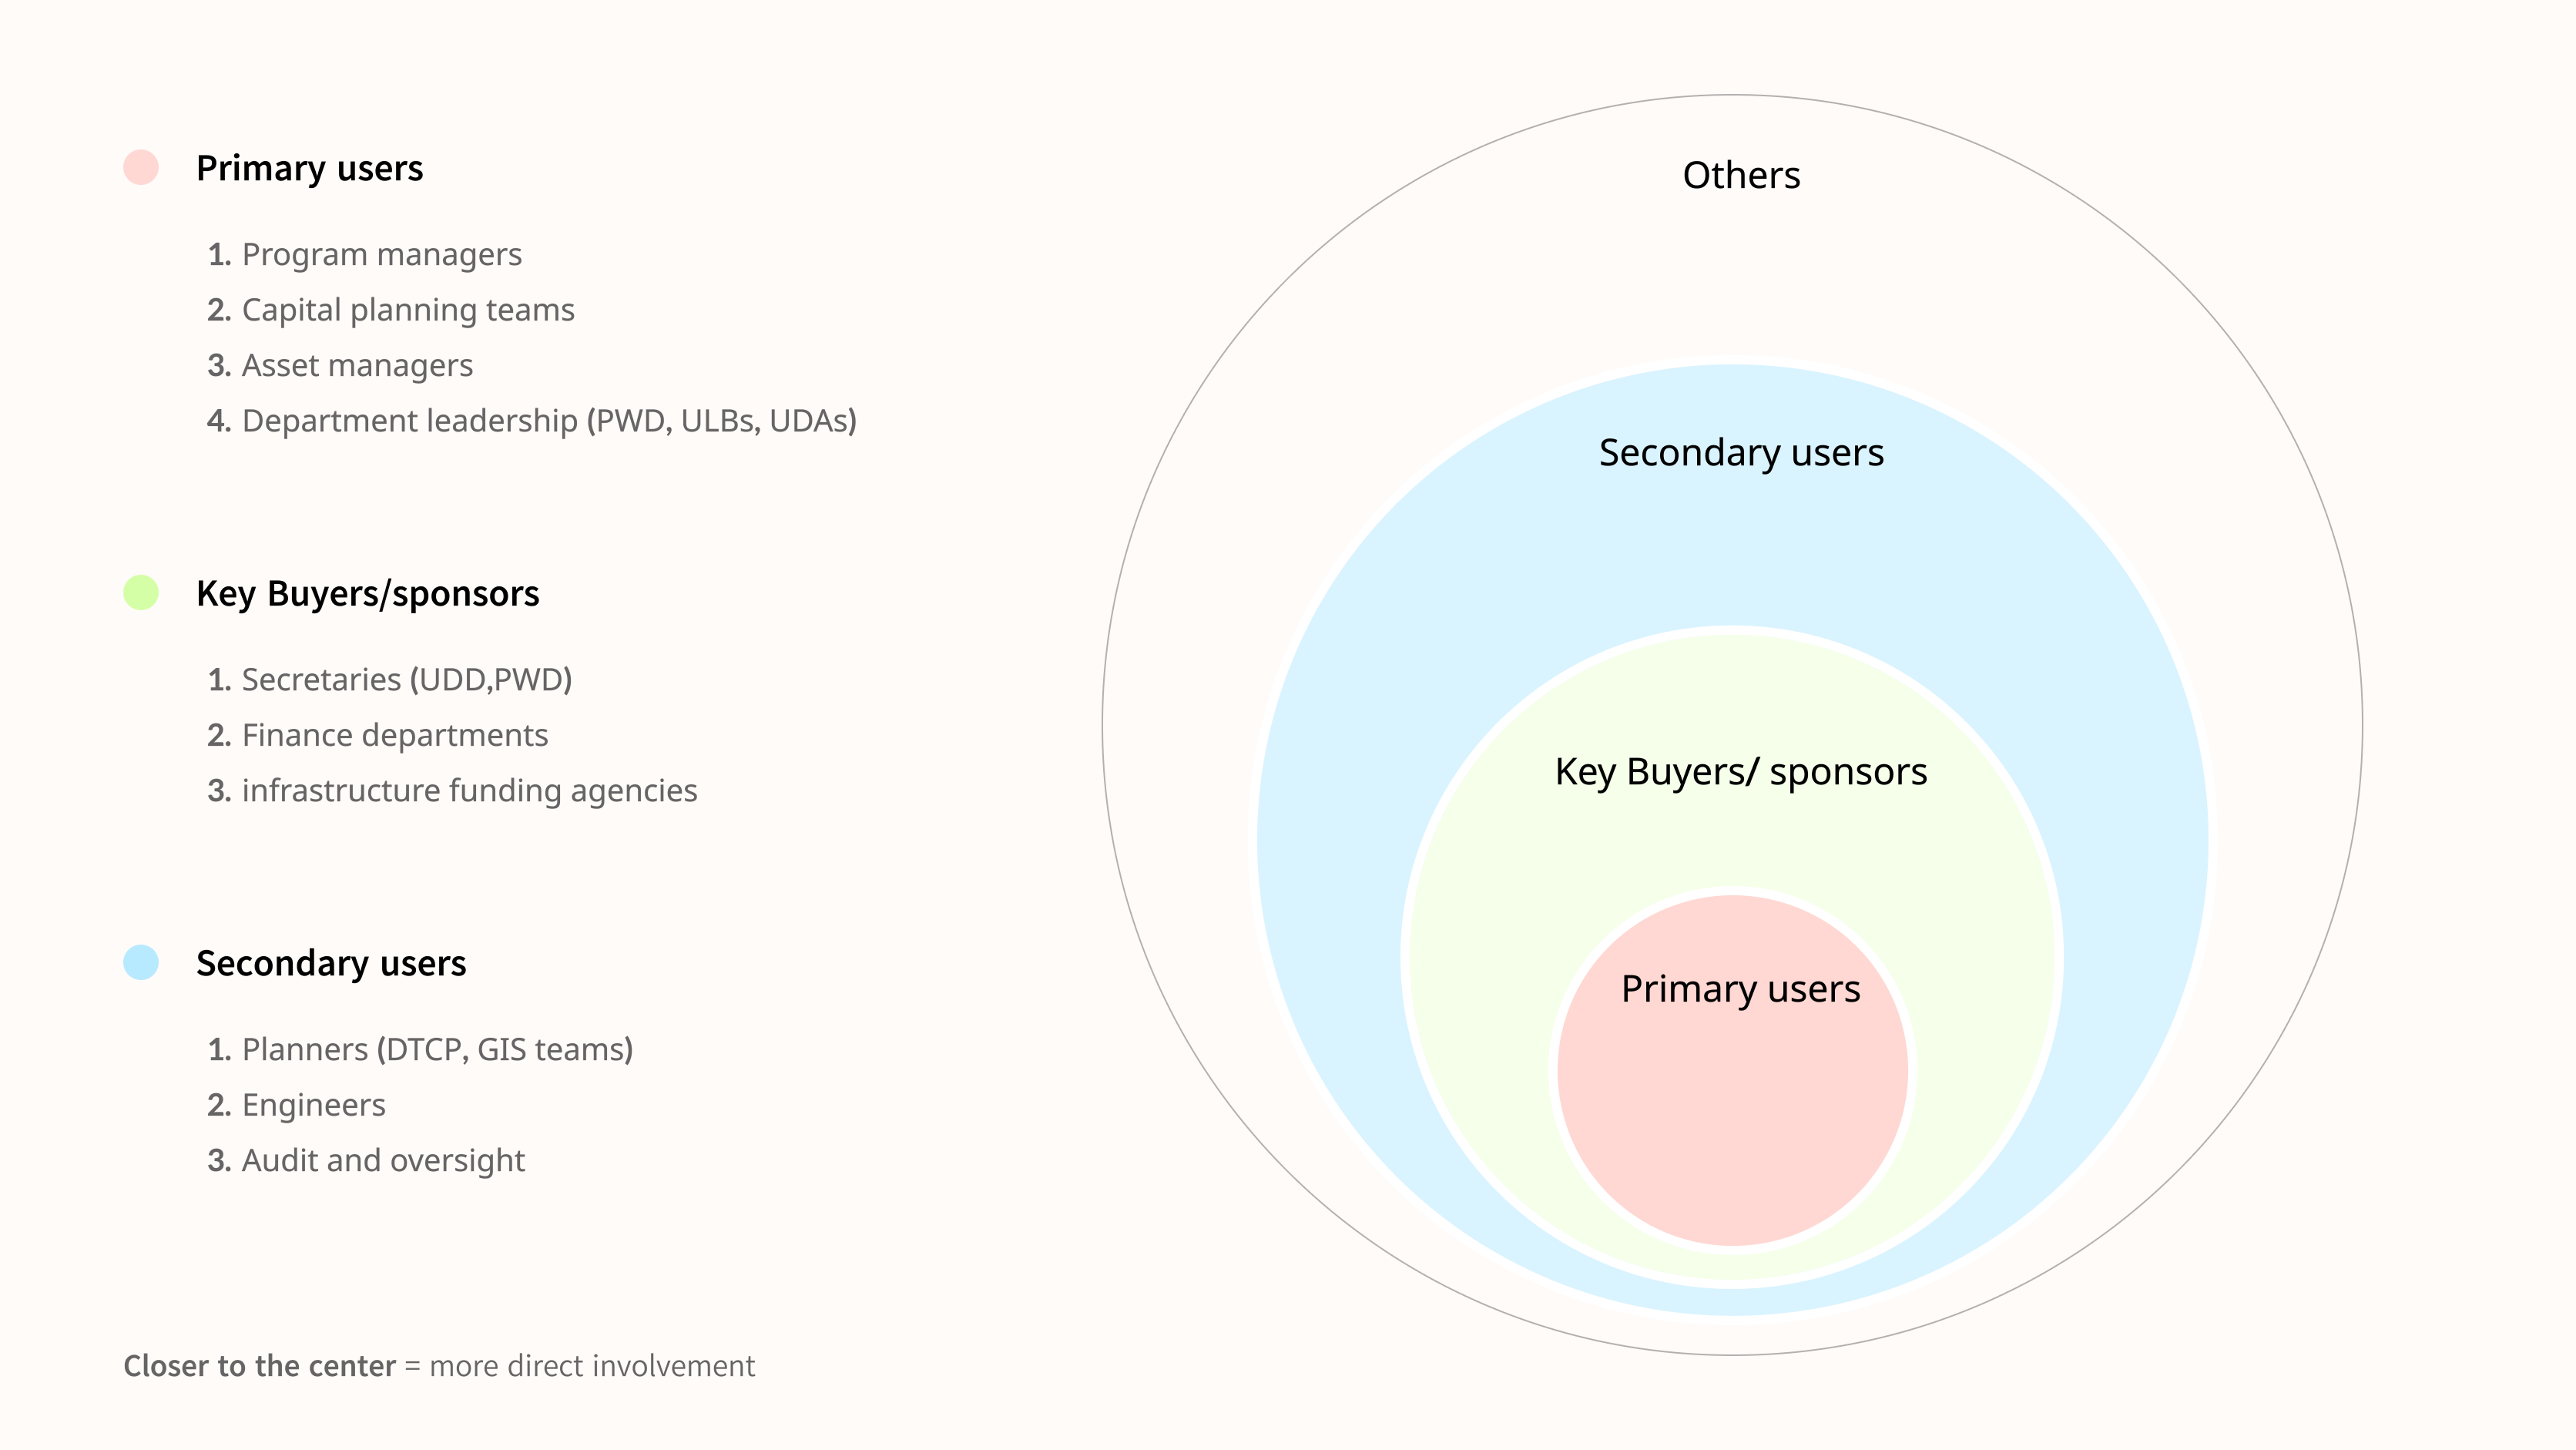
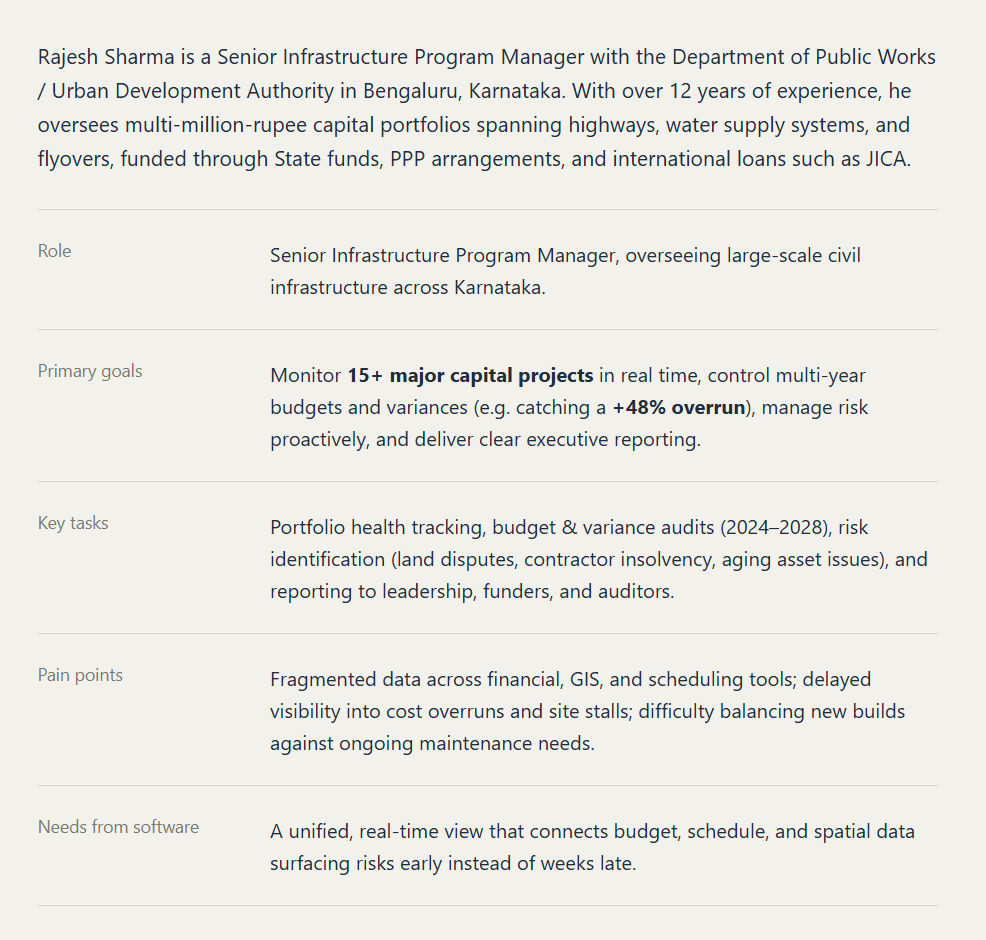
Defined key user roles, hierarchy, and data needs, pinpointing how decision-makers, financial auditors, and field engineers interact with project updates differently.
User persona
Competitor & System Benchmarking
I analyzed existing GIS platforms, capital project software, and administrative dashboards to identify UX gaps in spatial mapping and real-time risk visualization.
Domain & Document Audit
I reviewed standard public works reports, funding structures (PPP, State, JICA), and asset health inspection metrics to ensure our data models reflected real-world requirements.
Discovery phase outcomes
Identified Data Fragmentation: Auditing current public works documents revealed that spatial maps, multi-year budget spreadsheets, and asset inspection reports live in disconnected silos.
Mapped Key Metrics & Funding Types: Defined the core data structure required for the platform, including funding models (PPP, State, JICA), cost variance percentages, and structural risk indicators.
Pinpointed UX Gaps in Existing Tools: Benchmarking existing GIS and administrative platforms highlighted a lack of integrated early-warning systems and clear Gantt-style timeline visualization.
I synthesized the insights into problem statement. Translated audit findings into focused design challenges around budget transparency and asset risk monitoring.
Problem statement
Infrastructure program managers and regional authorities lack a unified tool to track capital project portfolios, resulting in fragmented monitoring of budget variances, site timelines, and asset degradation. Existing methods split spatial mapping, financial forecasting, and structural health tracking across disparate systems, making it difficult to detect project delays early or prioritize multi-year maintenance budgets.
Solution
An integrated infrastructure portfolio and asset management dashboard (KSIMYP) that consolidates spatial mapping, multi-year budget analytics, phase-by-phase timeline tracking, and AI-driven asset condition scoring into a single real-time view.
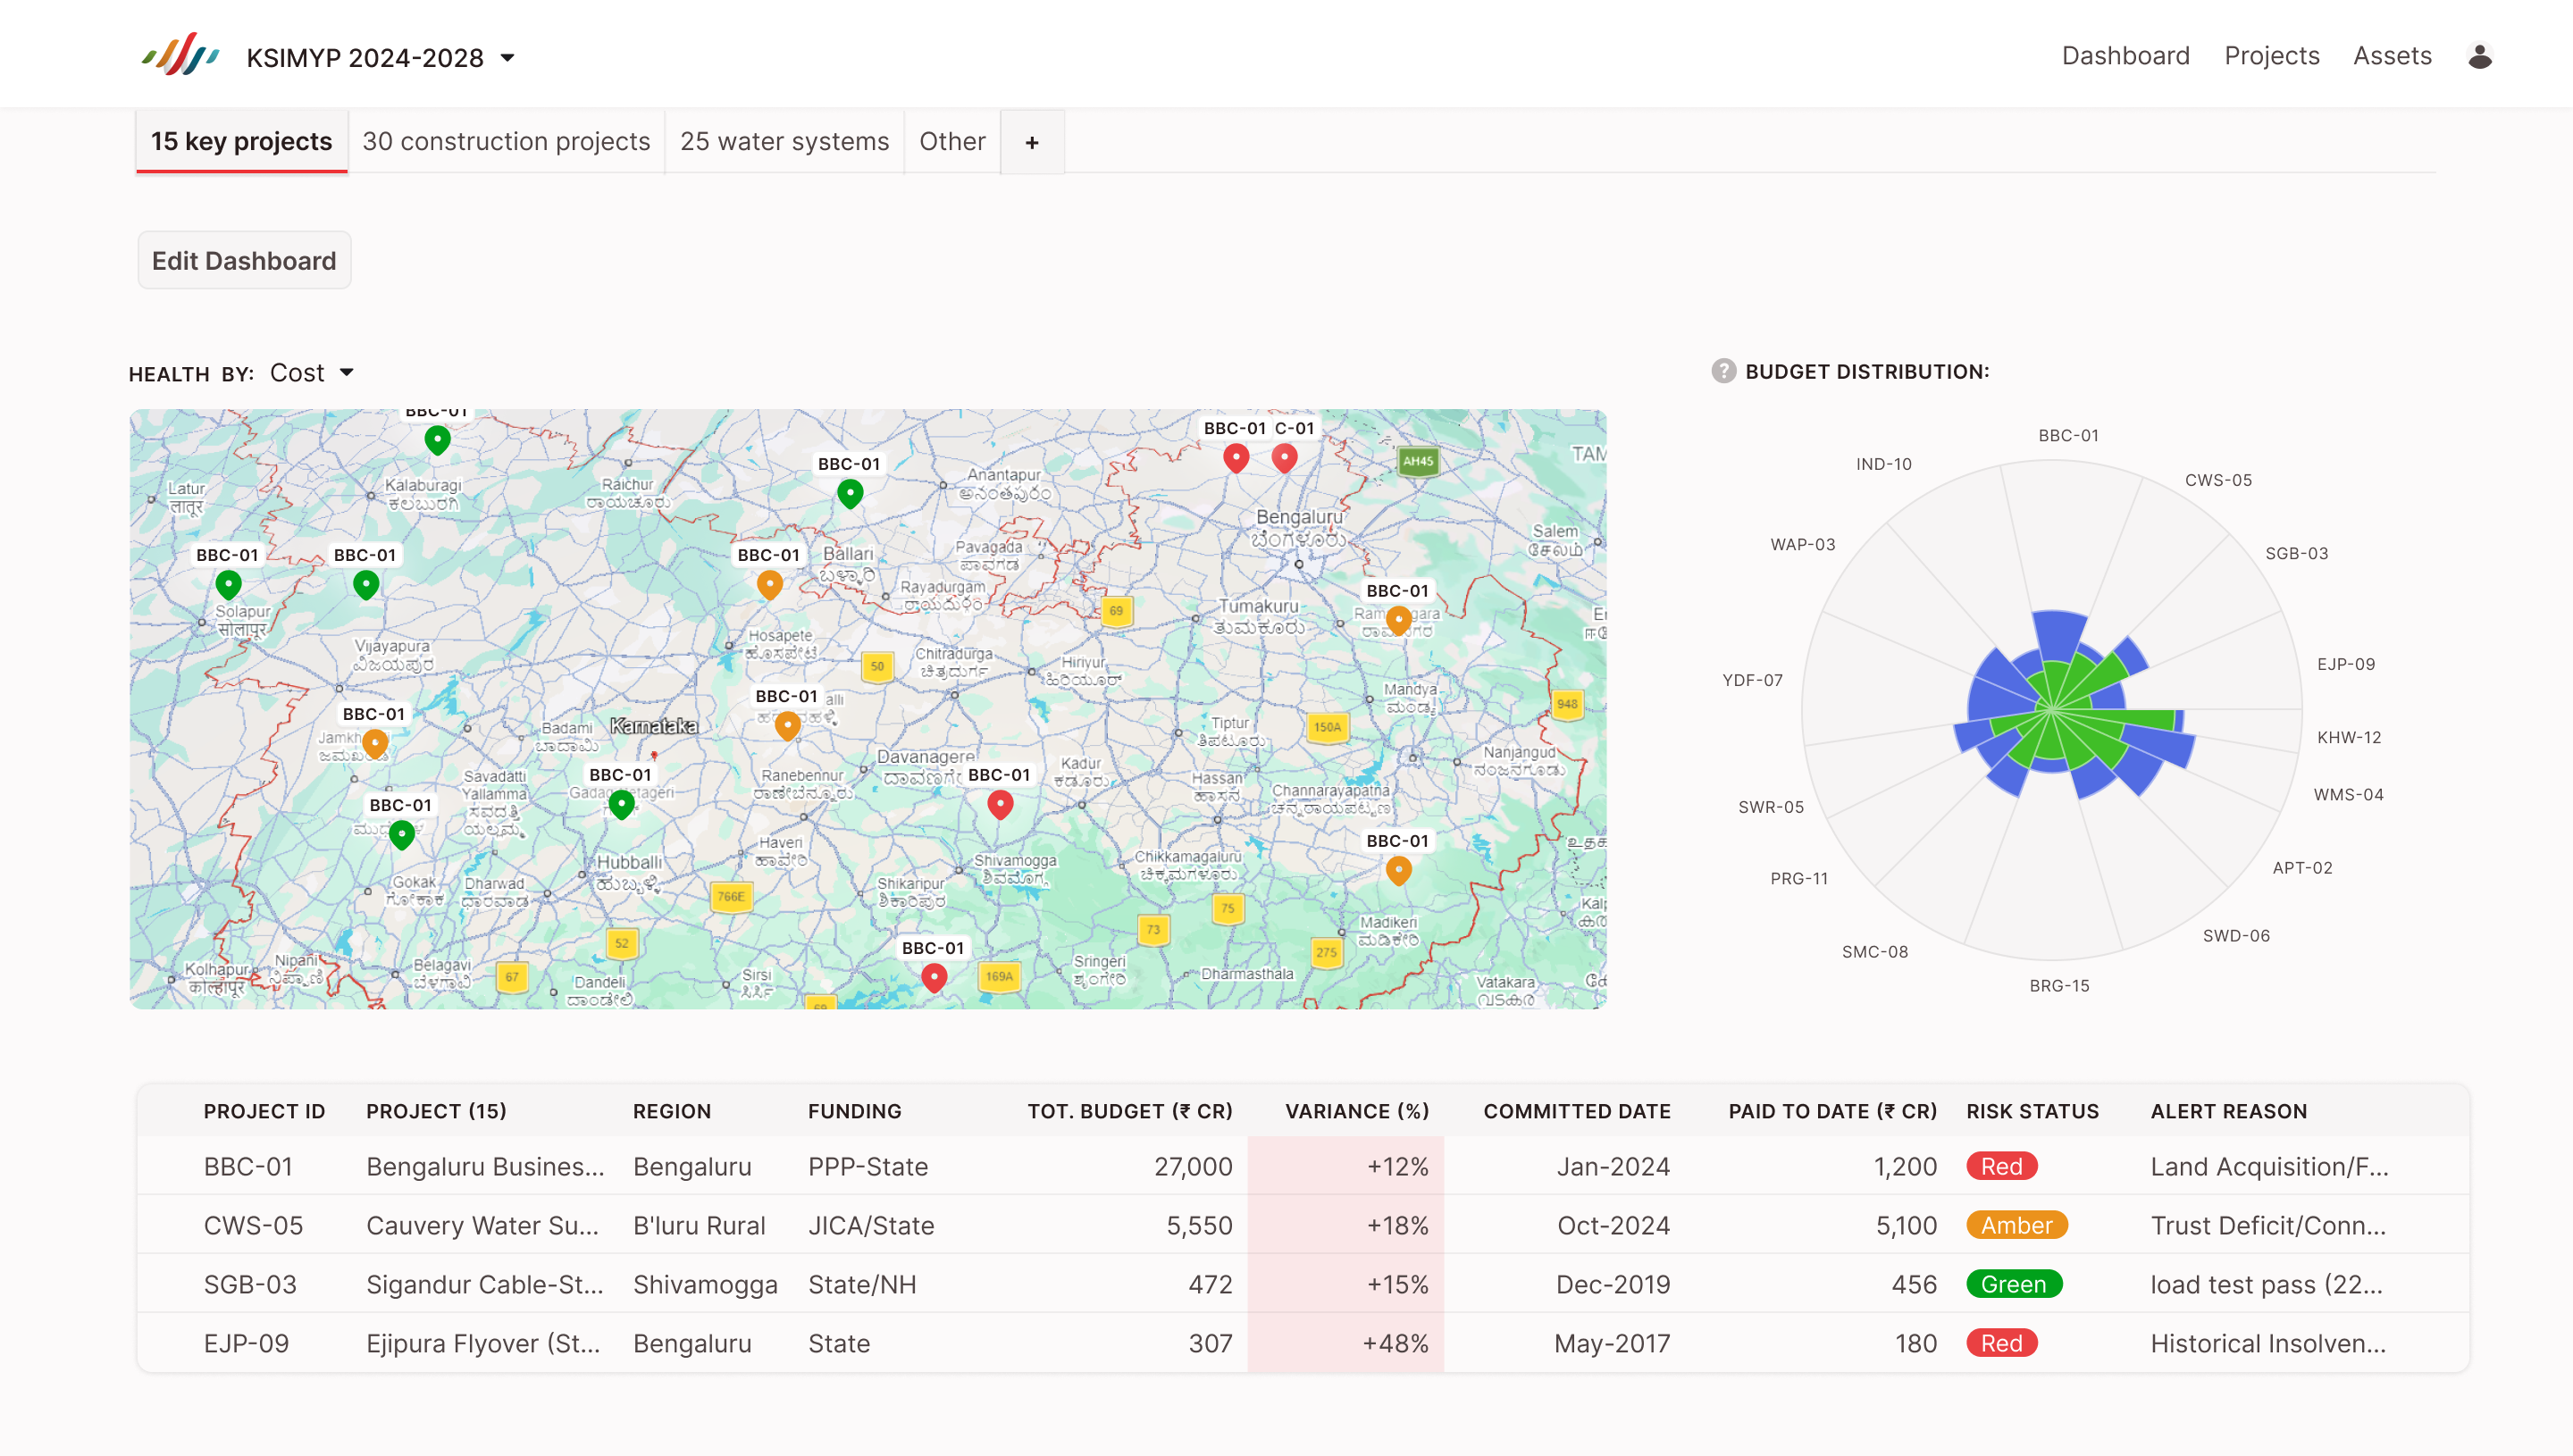
Portfolio Overview & Risk Map
Consolidates high-level project health across regions into an interactive spatial map paired with a sector-wide budget distribution chart. Gives decision-makers an immediate snapshot of total budget allocation, risk alerts, and cost variances across ongoing infrastructure initiatives.
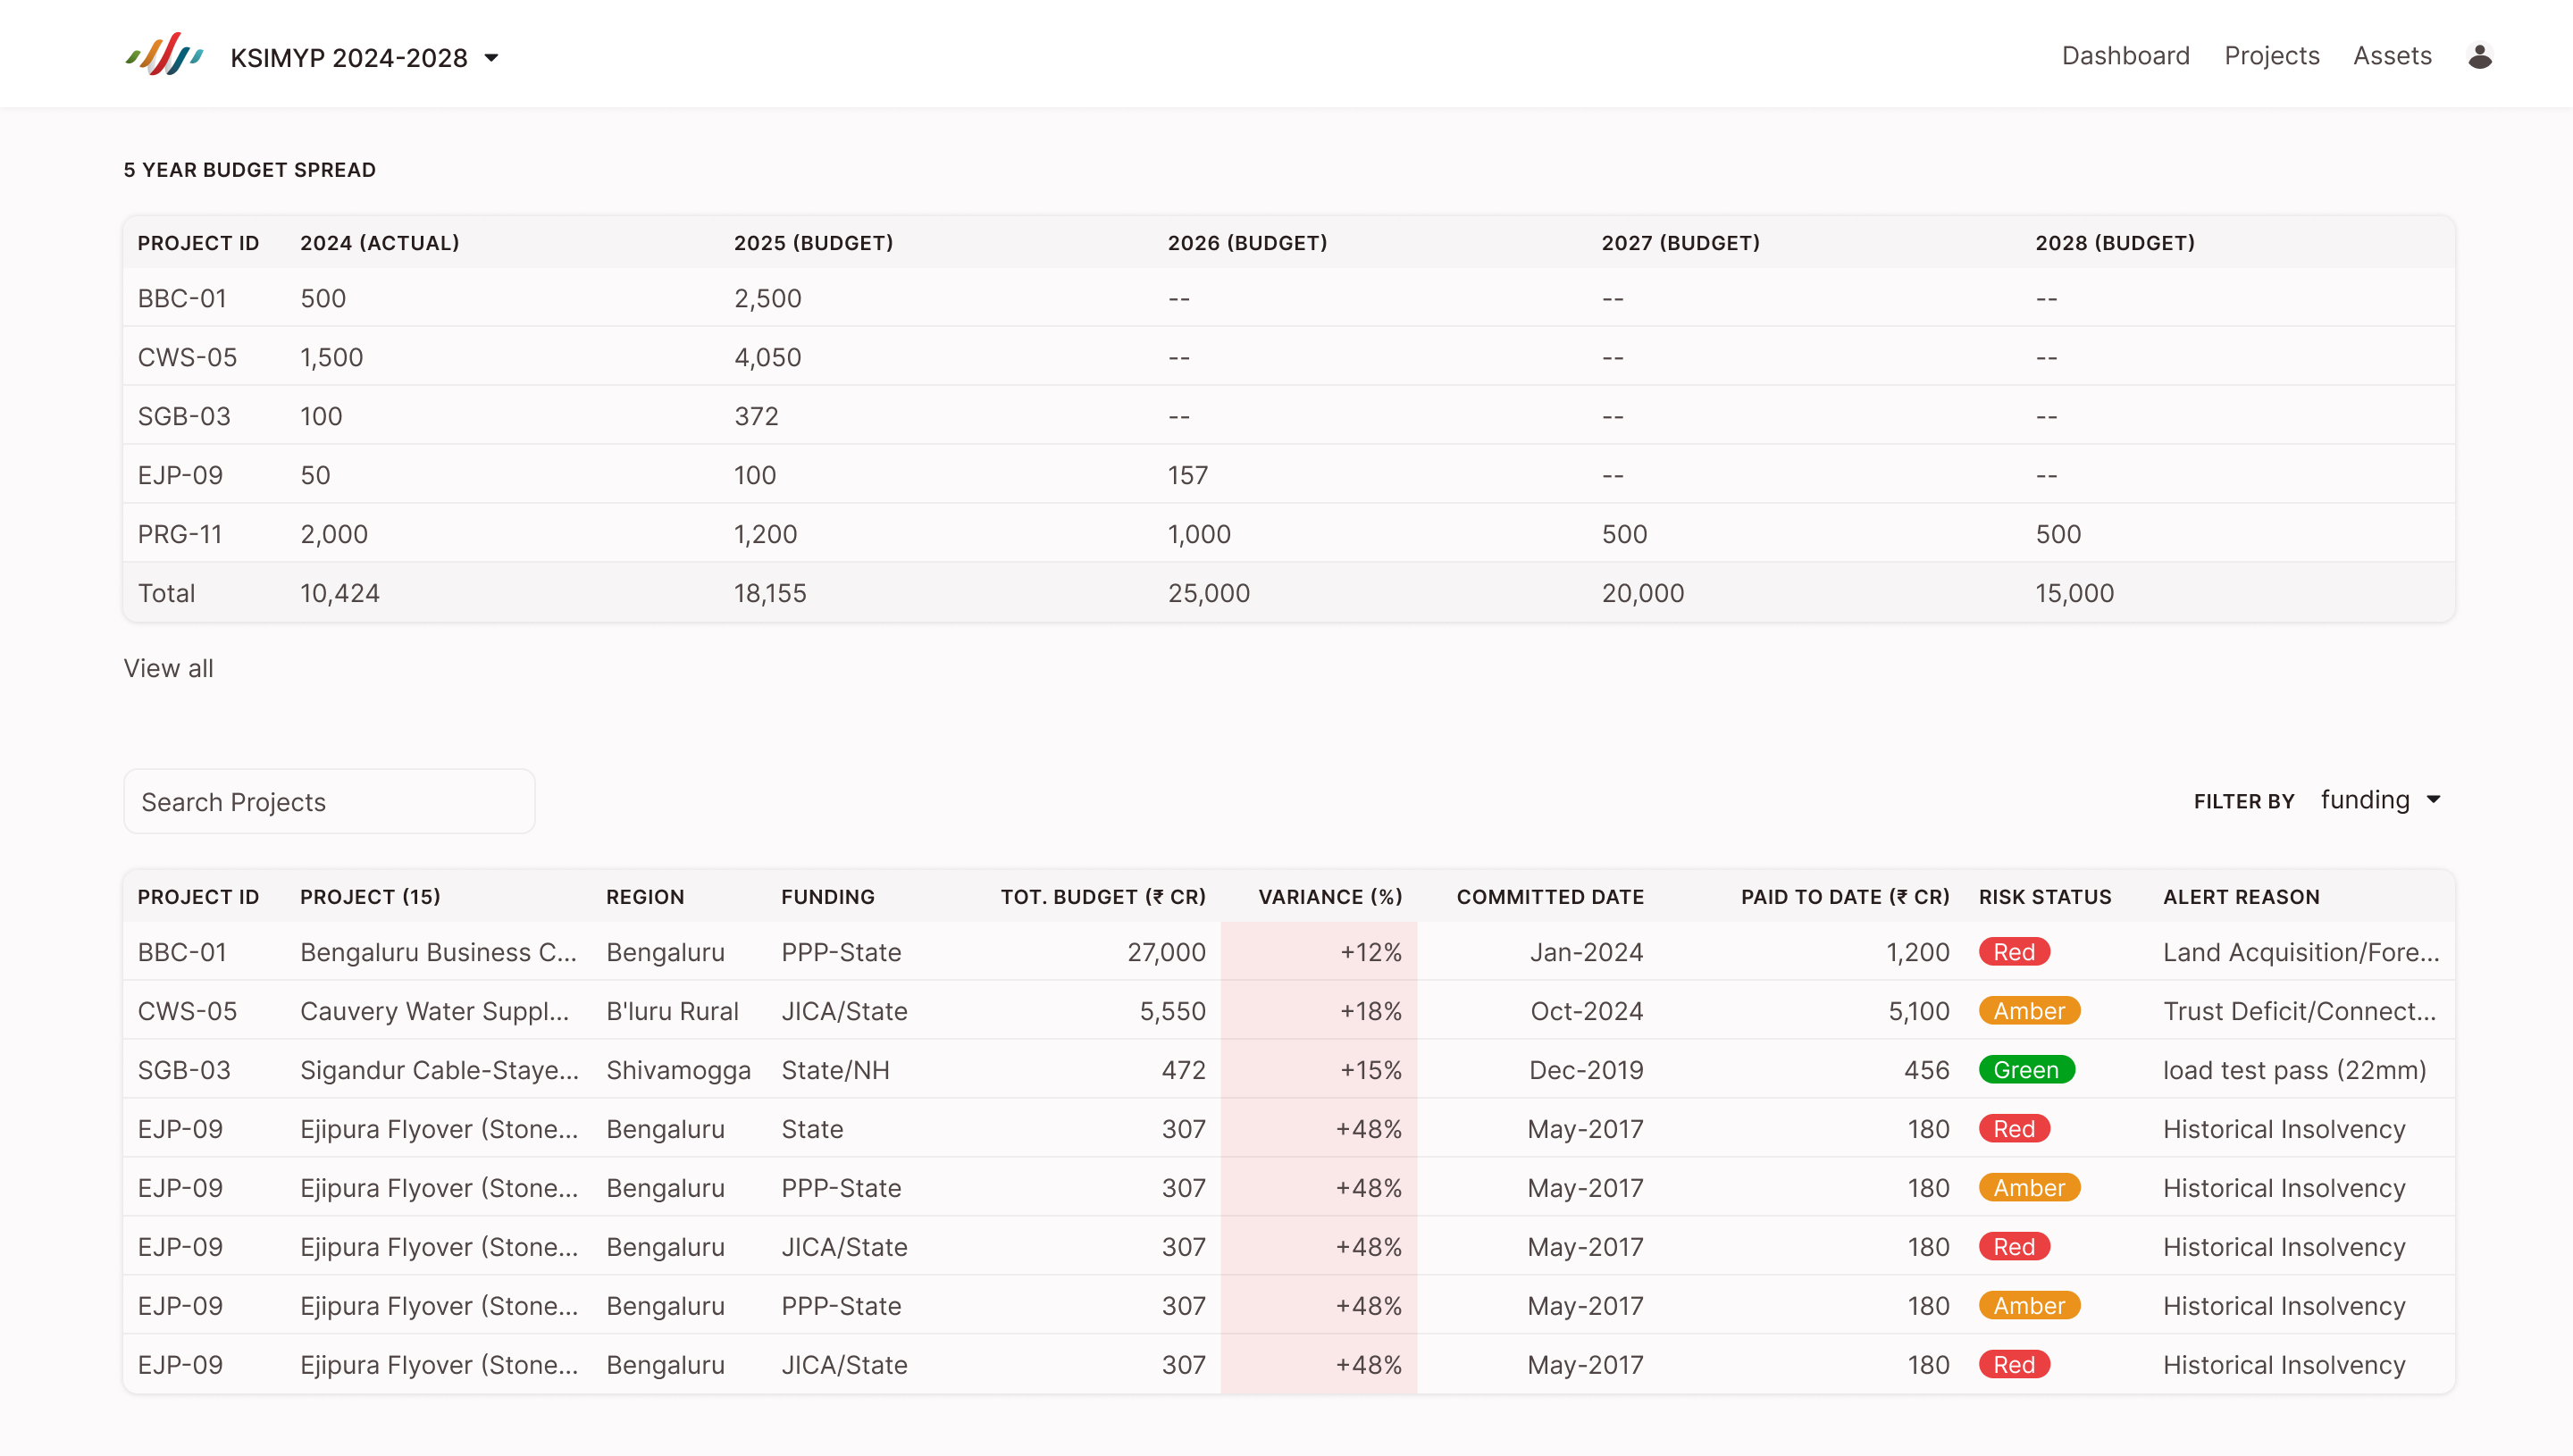
Multi-Year Financial & Budget Analytics
Provides a structured breakdown of five-year budget projections alongside total cost variances and funding models. Enables finance teams to track historical spending against future commitments and filter master project data by funding sources.
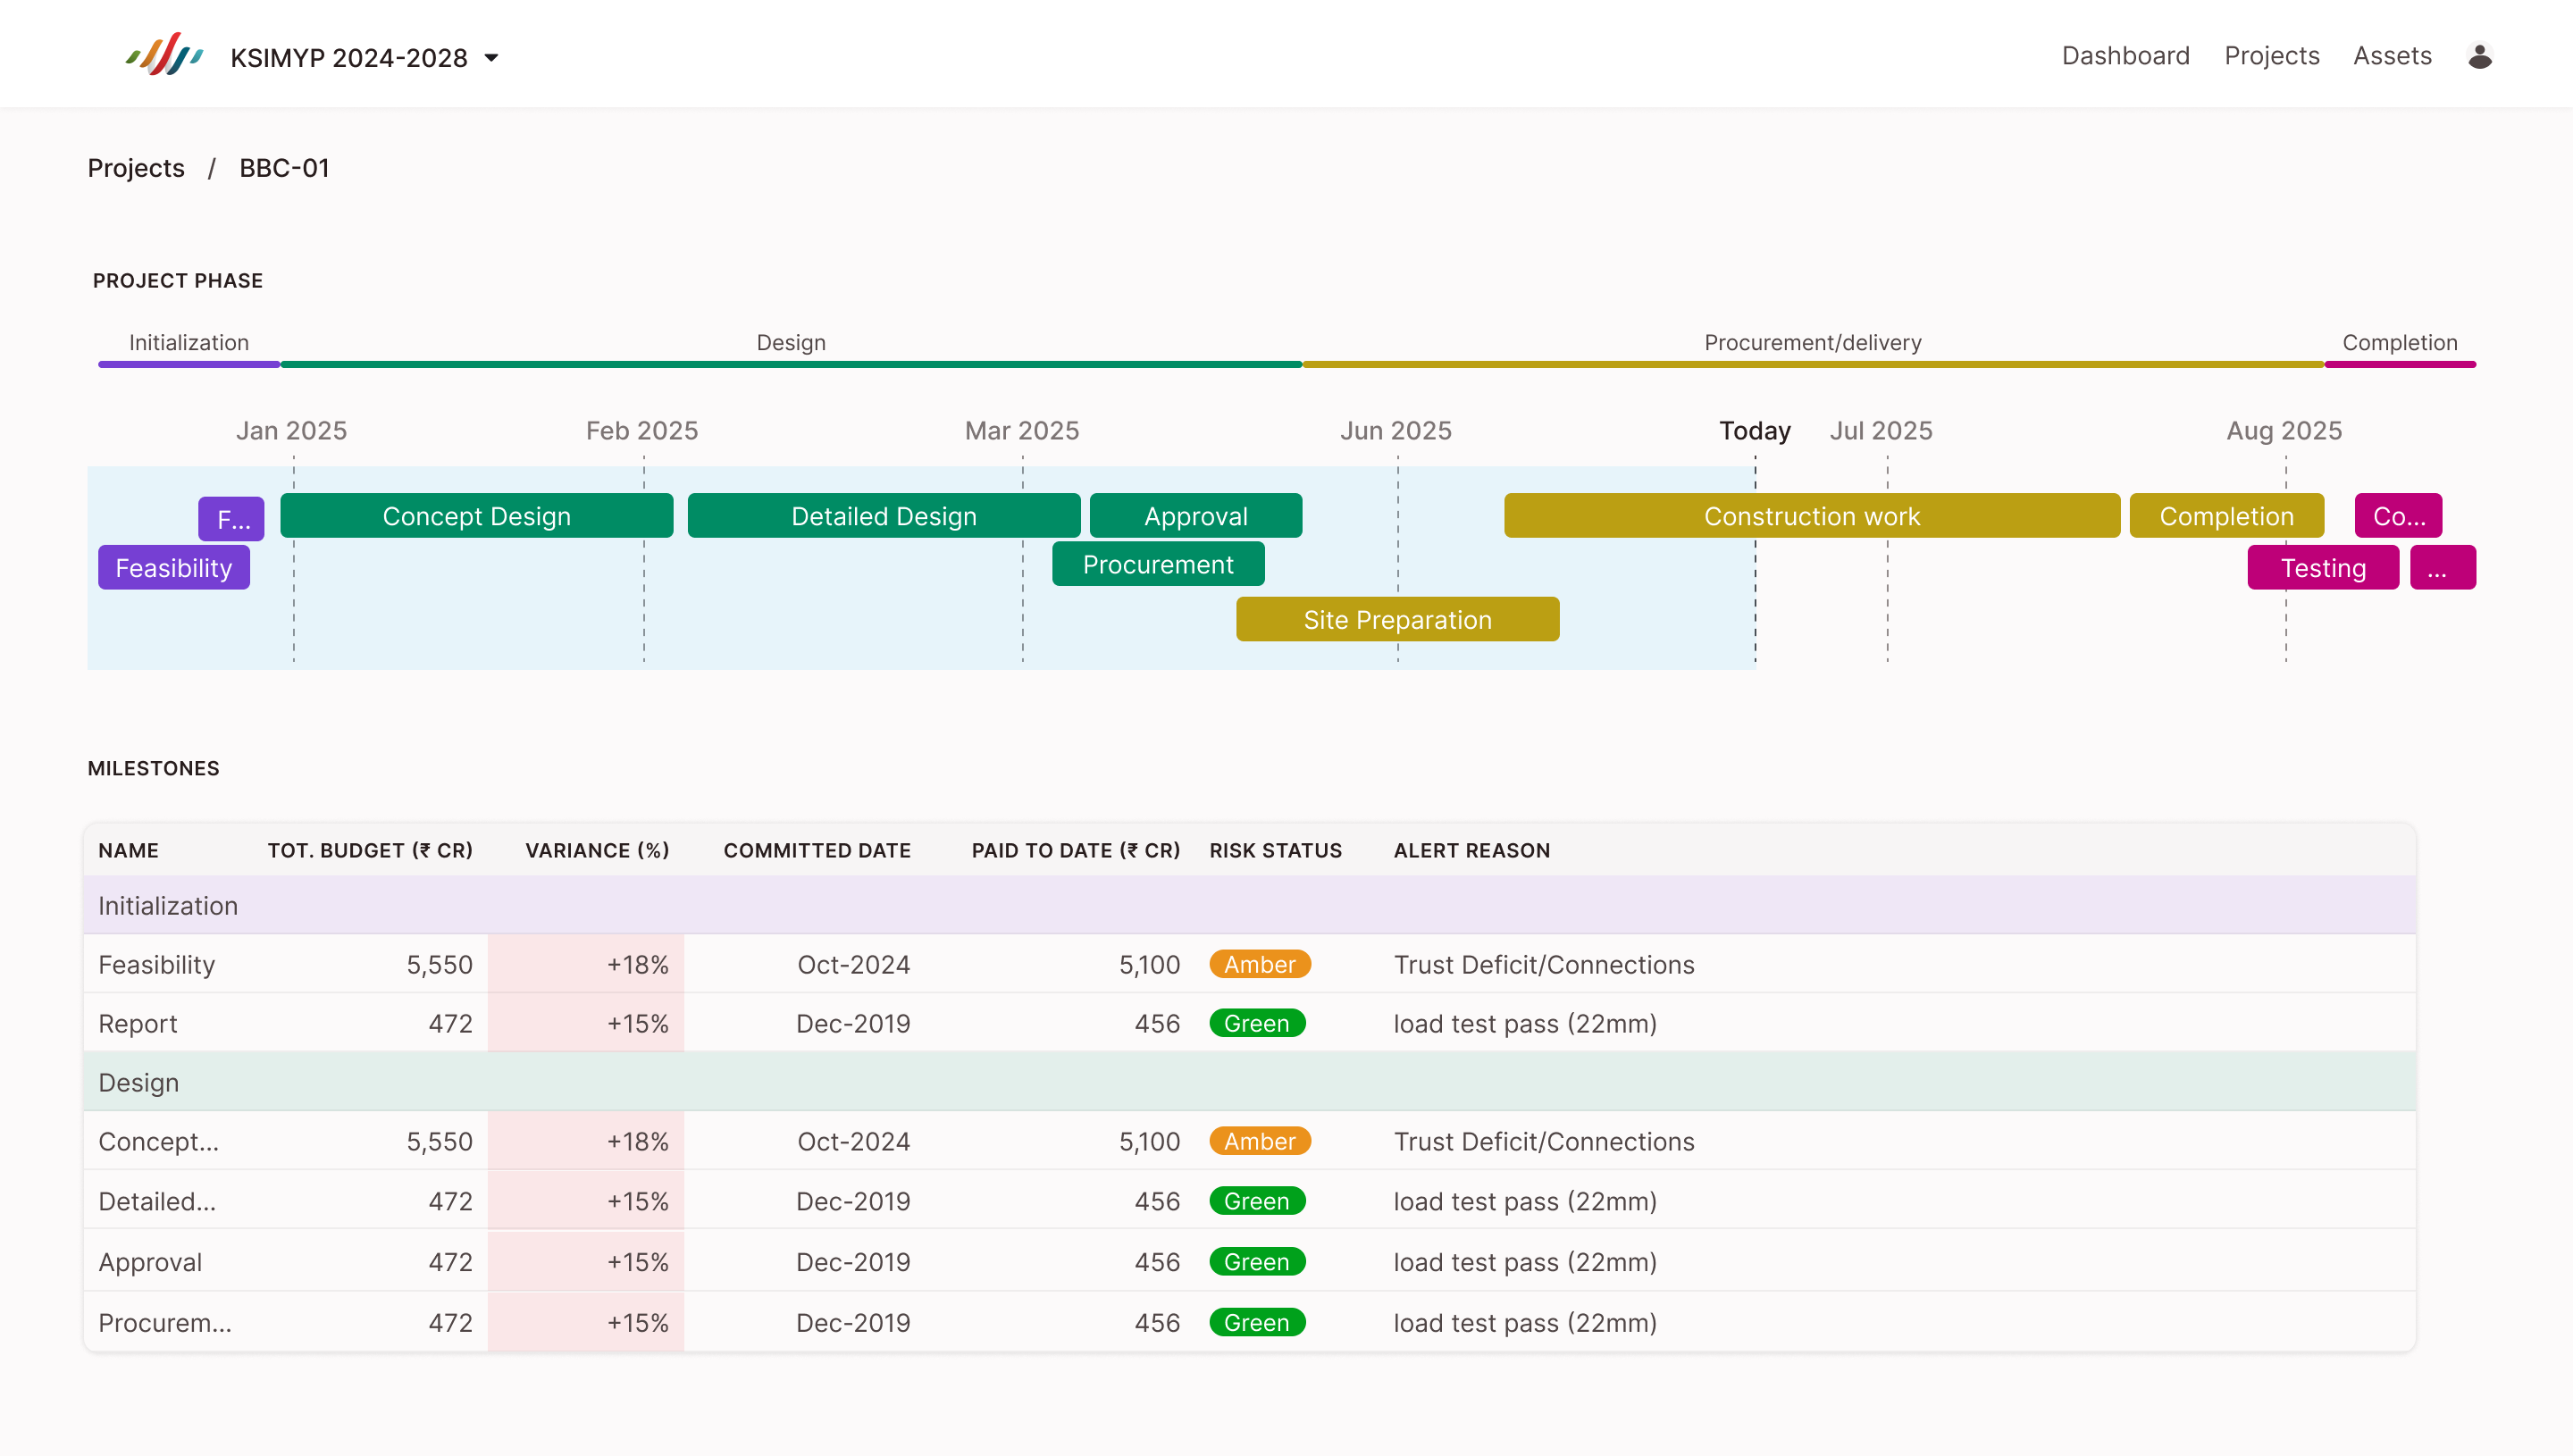
Project Timeline & Milestone Management
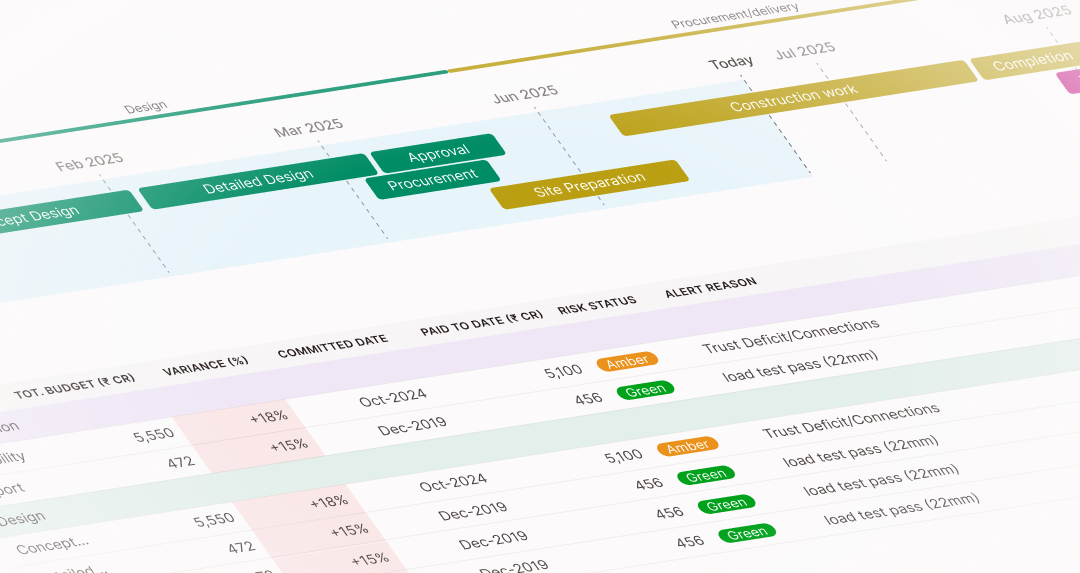
Visualizes end-to-end project lifecycles using a detailed Gantt chart that breaks down phases from initialization through delivery and completion. Allows project leads to cross-reference milestone progress against real-time risk statuses and alert reasons.
Asset Health & Maintenance Profile
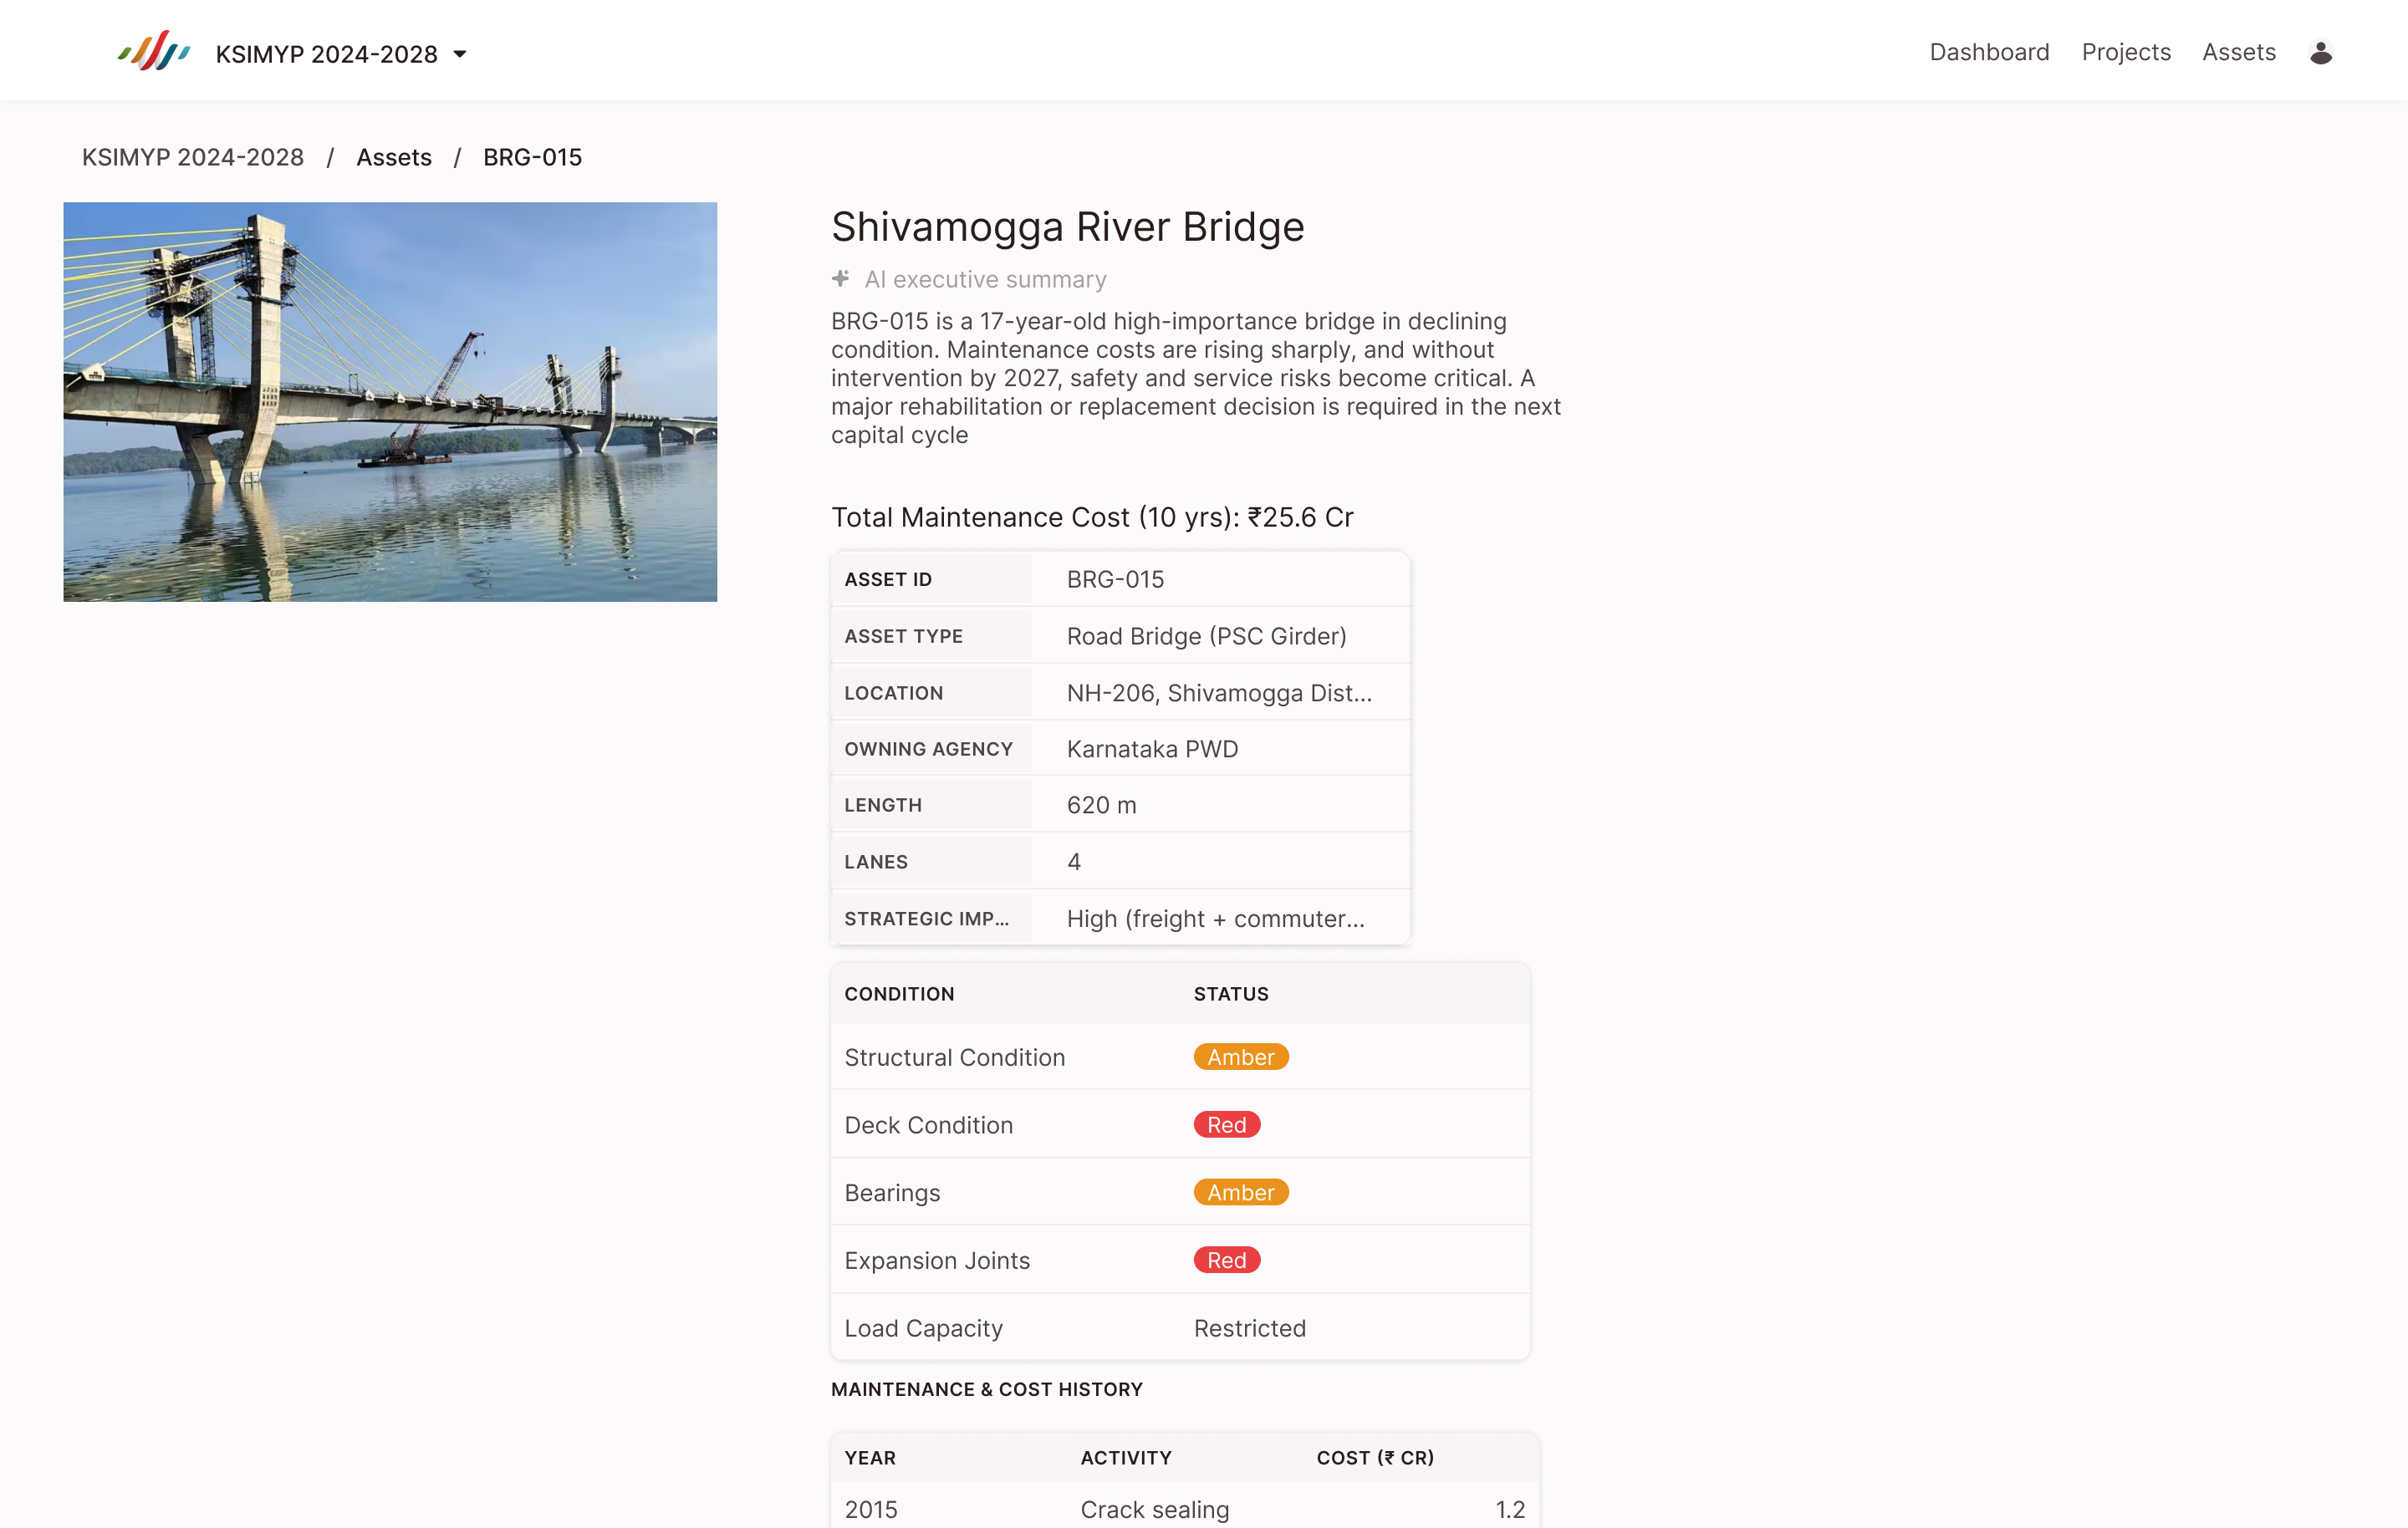
Delvers a deep dive into individual physical infrastructure assets, complete with structural condition ratings, technical specs, and AI-generated executive summaries. Tracks historical maintenance spending and pinpoints specific failure risks like deck condition or load capacity restrictions.